Saturday, November 15, 2008

Prepare and debug linux kernel with vmware 6

Vmware 6 includes kernel-debugging option which can replaced the kdb usage, Here's some explanation of this process:


The kernel source preparation:

Before the debugging we will have to prepare the source code and the debug image of the “debugged” kernel.


In my target machine (Inside the VMware) I'm using linux kernel 2.6.25.9-76.fc9.i686, first we will need to download the source code of this version and the vmlinux image file with debug symbols.
Thedownload location for this release is :
http://kojipkgs.fedoraproject.org/packages/kernel/2.6.25.9/76.fc9/
,
From there I downloaded the following files:

  • i686/kernel-devel-2.6.25.9-76.fc9.i686.rpm

  • i686/kernel-debuginfo-common-2.6.25.9-76.fc9.i686.rpm

  • i686/kernel-debuginfo-2.6.25.9-76.fc9.i686.rpm

  • src/kernel-2.6.25.9-76.fc9.src.rpm


Next, we need to install those packages, but before, We need to create the build directory tree for the source, The next command will create the SOURCES, SPECS and BUILD directories under ${HOME}/rpmbuild
#rpmdev-setuptree
Package installation (root user) :
# rpm -i <the packages>

Now, we need to prepare the source directories with all the patches:


# cd ~/rpmbuild/SPECS
# rpmbuild -bp --target=`uname -m` kernel.spec

The VMware 6 preparation:

Open the VMware configuration file (/etc/vmware/config) and add the following line:

debugStub.listen.guest32=1

Now, We will see the following line in the vmware log file, which mean that we are ready for debug:


VMware Workstation is listening for debug connection on port 8832.

The GDB preparation:

Instead of running the gdb with all the debugging arguments every time, we can edit the .gdbinit file with the initial configuration,
This file should be located either in the current directory or in the
home directory.
Add to the .gdbinit the following line to determine the file to launch:
file /usr/lib/debug/lib/modules/2.6.25.9-76.fc9.i686/vmlinux

Add the .gdbinit the following line in order to tell gdb to connect the remote host:


target remote localhost:8832

Now we will configure the source-code directories, After the previous
steps, the source code is located under ${HOME}/rpmbuild/BUILD/kernel-2.6.25/linux-2.6.25.i686 , to automatically insert all the sub directories, run the following command on bash:

#for file in `find ~/rpmbuild/BUILD/kernel-2.6.25/linux-2.6.25.i686 -type d`; do echo dir $file;done >> ~/.gdbinit

Debugging !!!

Now, all we need to do is to type
#gdb
(or ddd) In order to launch the debugger.


One issue I faced is that if I'm pausing the vmware guest machne to long, its shut down and I need to restart the guest OS again, still need to figure out this one ........
Wednesday, November 5, 2008

Display system information on desktop using Conky

Hi,
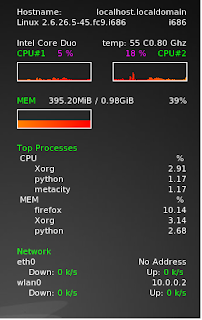
For those of you who want to know your machine performance while running your Linux, There is a very good system monitor for the X system which called Conky.

Conky can display almost all the information you needed on the desktop.
I downloaded it using yum :
#yum install Conky

But you can download it from its formal web as well :
http://conky.sourceforge.net/

In order to display the information you see on the attached image the ~/.conkyrc file should be as followed:


# Conky sample configuration

# set to yes if you want Conky to be forked in the background
background yes

# Use Xft?
use_xft yes

# Xft font when Xft is enabled
xftfont xirod:size=9

# Text alpha when using Xft
xftalpha 0.8

# mail spool
mail_spool $MAIL

# Update interval in seconds
update_interval 2.5

# This is the number of times Conky will update before quitting.
# Set to zero to run forever.
total_run_times 0

# Create own window instead of using desktop (required in nautilus)
own_window 1

# If own_window is yes, you may use type normal, desktop or override
own_window_type override

# Use pseudo transparency with own_window?
own_window_transparent 1

# If own_window_transparent is set to no, you can set the background colour here
own_window_colour hotpink

# If own_window is yes, these window manager hints may be used
#own_window_hints undecorated,below,sticky,skip_taskbar,skip_pager

# Use double buffering (reduces flicker, may not work for everyone)
double_buffer yes

# Minimum size of text area
minimum_size 280 5

maximum_width 230

# Draw shades?
draw_shades no

# Draw outlines?
draw_outline no

# Draw borders around text
draw_borders no

# Draw borders around graphs
draw_graph_borders yes

# Stippled borders?
stippled_borders 8

# border margins
border_margin 4

# border width
border_width 1

# Default colors and also border colors
default_color white

# Text alignment, other possible values are commented
#alignment top_left
alignment top_right
#alignment bottom_left
#alignment bottom_right
#alignment none

# Gap between borders of screen and text
# same thing as passing -x at command line
gap_x 20
gap_y 15

# Subtract file system buffers from used memory?
no_buffers yes

# set to yes if you want all text to be in uppercase
uppercase no

# number of cpu samples to average
# set to 1 to disable averaging
cpu_avg_samples 2

# number of net samples to average
# set to 1 to disable averaging
net_avg_samples 2

# Force UTF8? note that UTF8 support required XFT
override_utf8_locale no

# Add spaces to keep things from moving about? This only affects certain objects.
use_spacer none

# Allow each port monitor to track at most this many connections (if 0 or not set, default is 256)
#max_port_monitor_connections 256

# Maximum number of special things, e.g. fonts, offsets, aligns, etc.
#max_specials 512

# Maximum size of buffer for user text, i.e. below TEXT line.
#max_user_text 16384

# variable is given either in format $variable or in ${variable}. Latter
# allows characters right after the variable and must be used in network
# stuff because of an argument

# stuff after 'TEXT' will be formatted on screen

TEXT
Hostname:$alignr$nodename
$sysname $kernel $alignr $machine

Intel Core Duo $alignr temp: $acpitemp C$alignr${freq_g cpu2} Ghz
${color green}CPU#1 ${color white}${cpu cpu1} %${alignr}${cpu cpu2} %${color green} CPU#2
${color white}${cpugraph cpu1 25,100 FF8200 ff0000} ${alignr}${cpugraph cpu2
25,100 FF0000 FF9900}$color

${color green}MEM$color $alignc $mem / $memmax $alignr $memperc%
${color white}${memgraph cpu1 25,100 FF8200 ff0000}$color

${color green}Top Processes$color
CPU $alignr %
${top name 1}$alignr${top cpu 1}
${top name 2}$alignr${top cpu 2}
${top name 3}$alignr${top cpu 2}
MEM $alignr %
${top_mem name 1}$alignr${top_mem mem 1}
${top_mem name 2}$alignr${top_mem mem 2}
${top_mem name 3}$alignr${top_mem mem 3}

${color green}Network$color
eth0 $alignr ${addr eth0}
${color white}Down: ${color green}${downspeed eth0} k/s ${alignr}${color white}Up:${color green} ${upspeed eth0} k/s $color
wlan0 $alignr ${addr wlan0}
${color white}Down: ${color green}${downspeed wlan0} k/s ${alignr}${color white}Up:${color green} ${upspeed wlan0} k/s